UK foot-and-mouth disease economic impacts: an integrated farm, policy, market and trade laboratory
Working LP, DP and PE economic models with editable assumptions, published aggregate scenario context, sensitivity analysis and reproducible downloads.
Dr Bouda Vosough Ahmadi · Veterinarian and agricultural economist
Main findings
The laboratory now contains a full monthly farm LP, a finite-horizon policy DP and a market-clearing PE welfare model. Central net changes are -£1,070 in the farm LP, £1.89m in the policy DP, and -£204.54m in annual domestic PE welfare. These are different systems and must not be added.
Published FMD outcomes remain fixed background context. No new premises, spatial spread or outbreak duration is simulated.
1. Published scenario context
Users choose the published median stamping-out or vaccination-to-die context from Feng, Patton and Davis (2017), then edit economic assumptions.
| Measure | Stamping out median | Vaccinate-to-die median |
|---|---|---|
| Days to application for disease-free status | 171 | 141 |
| Beef price versus baseline | -7.9% | -5.7% |
| Sheepmeat price versus baseline | -24.5% | -18.4% |
| Pigmeat price versus baseline | -17.4% | -13.6% |
2. Data and model boundaries
The PE reference uses editable 2025 UK production, price and trade anchors. The three trade CSV candidates named in the repository UK PE engine are empty, so the laboratory does not claim to run them. Published FMD price and output results supply scenario context; repository farm coefficients supply the LP resource structure.
The three models answer different questions and operate at different scales. Their results must not be added.
3. Farm LP methods and results
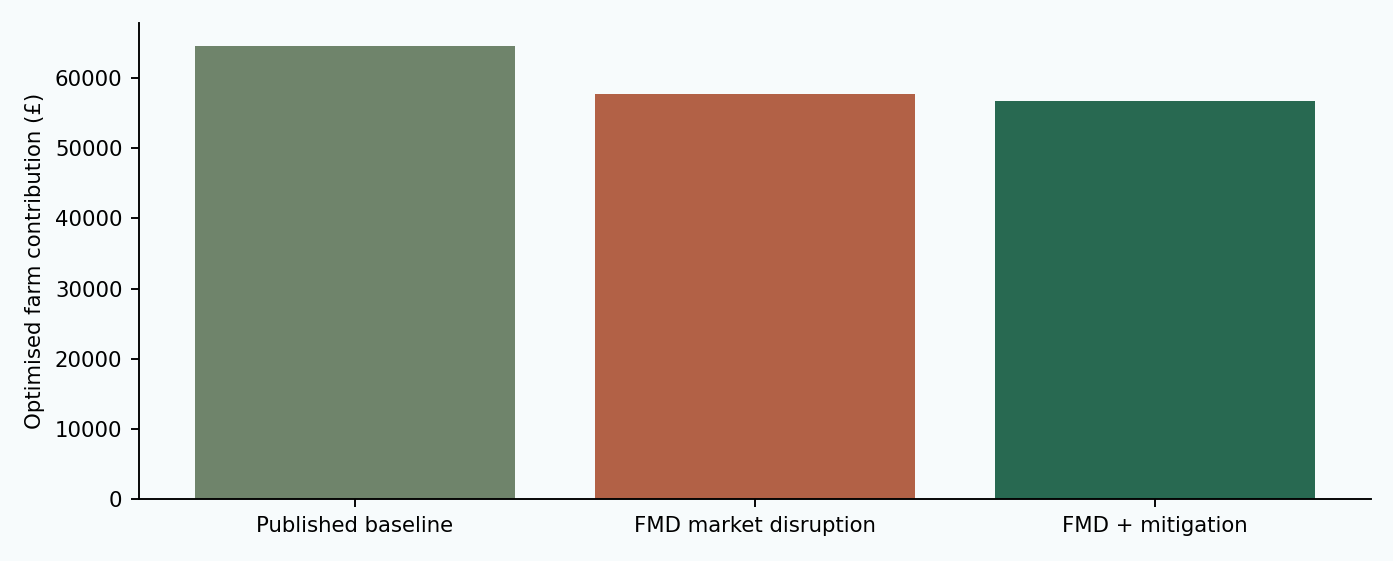
The LP optimises sheep/cattle head and six monthly feed sources subject to intake, energy, protein, forage, labour and annual feed constraints. The objective is gross enterprise output minus non-feed costs, feed, disruption damage and mitigation resources. The two-phase simplex reports feasibility, binding constraints, iterations and maximum residual.
| Scenario | Sheep head | Cattle head | Farm contribution | Government | Net farm-resource surplus |
|---|---|---|---|---|---|
| Published baseline | 481.4 | 55.0 | £64,544 | £0 | £64,544 |
| FMD market disruption | 464.8 | 55.0 | £57,690 | £0 | £57,690 |
| FMD + economic mitigation | 474.0 | 55.0 | £56,620 | £0 | £56,620 |
Pig and dairy enterprises are not present in the source monthly farm LP and are not fabricated here.
4. Policy DP methods and results
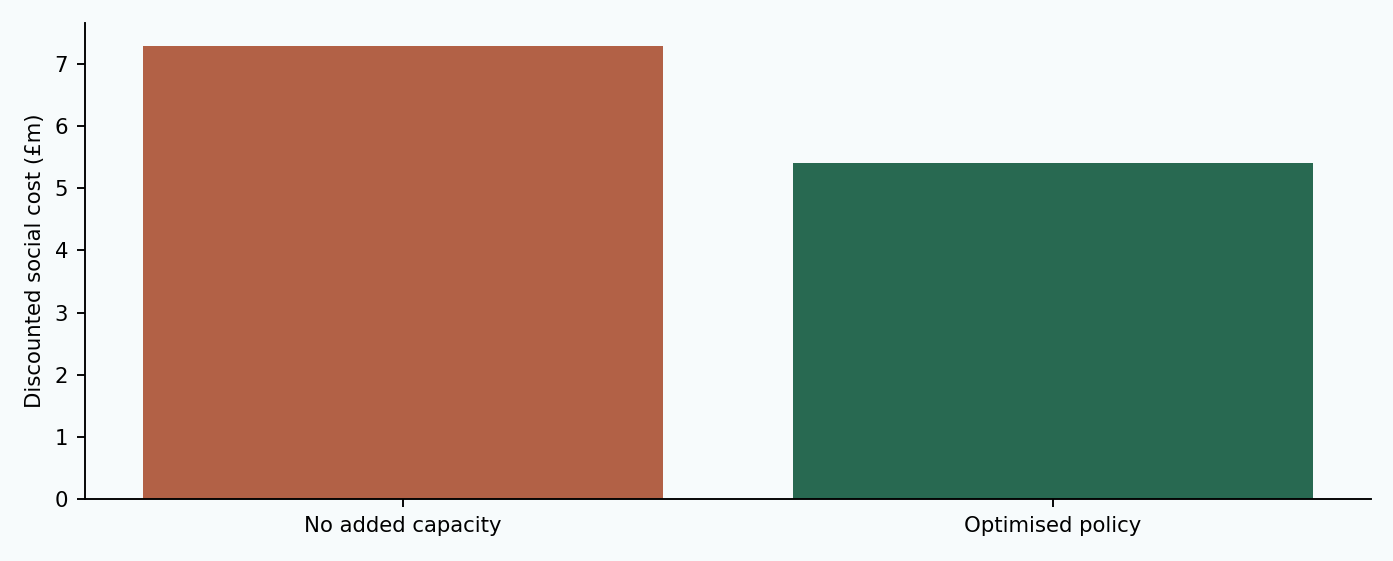
The DP solves Vt(s) = min a {C(s,a) + beta E[Vt+1(s prime)]} over aggregate economic disruption pressure, preparedness coverage and market-recovery capacity. It compares no added capacity, rapid-response capacity, vaccination preparedness and integrated recovery support under a quarterly public budget.
These are aggregate economic states, not simulated epidemiological states. Transition coefficients remain research assumptions pending calibration against matched UK aggregate scenario outputs.
| Account | No added capacity | Optimised policy |
|---|---|---|
| Discounted social cost | £7.29m | £5.40m |
| Government expenditure | £0 | £699,163 |
| Private cost | £7.29m | £4.70m |
| Net social saving | - | £1.89m |
5. PE market and welfare methods
For each market, price solves domestic supply plus imports minus demand and exports equal to zero. Constant elasticities govern response. Consumer and producer surplus are integrated from these curves. Subsidies and compensation enter producer and government accounts and cancel from domestic welfare except for real resources and administration.
| Market / scenario | Price | Output | Imports | Exports | Exposed share |
|---|---|---|---|---|---|
| Sheepmeat / Published baseline | £7.100 | 282.00 | 91.00 | 99.00 | 0.0% |
| Beef / Published baseline | £6.470 | 898.00 | 309.00 | 142.00 | 0.0% |
| Pigmeat / Published baseline | £2.013 | 937.00 | 766.00 | 342.00 | 0.0% |
| Sheepmeat / FMD market disruption | £5.547 | 259.81 | 62.85 | 12.67 | 20.0% |
| Beef / FMD market disruption | £5.835 | 872.49 | 264.67 | 15.74 | 12.0% |
| Pigmeat / FMD market disruption | £1.772 | 890.67 | 608.99 | 39.85 | 15.0% |
| Sheepmeat / FMD + economic mitigation | £6.139 | 269.04 | 73.16 | 47.52 | 13.1% |
| Beef / FMD + economic mitigation | £6.065 | 882.44 | 280.43 | 62.87 | 7.9% |
| Pigmeat / FMD + economic mitigation | £1.863 | 909.55 | 666.38 | 155.74 | 9.9% |
6. Distributional PE results
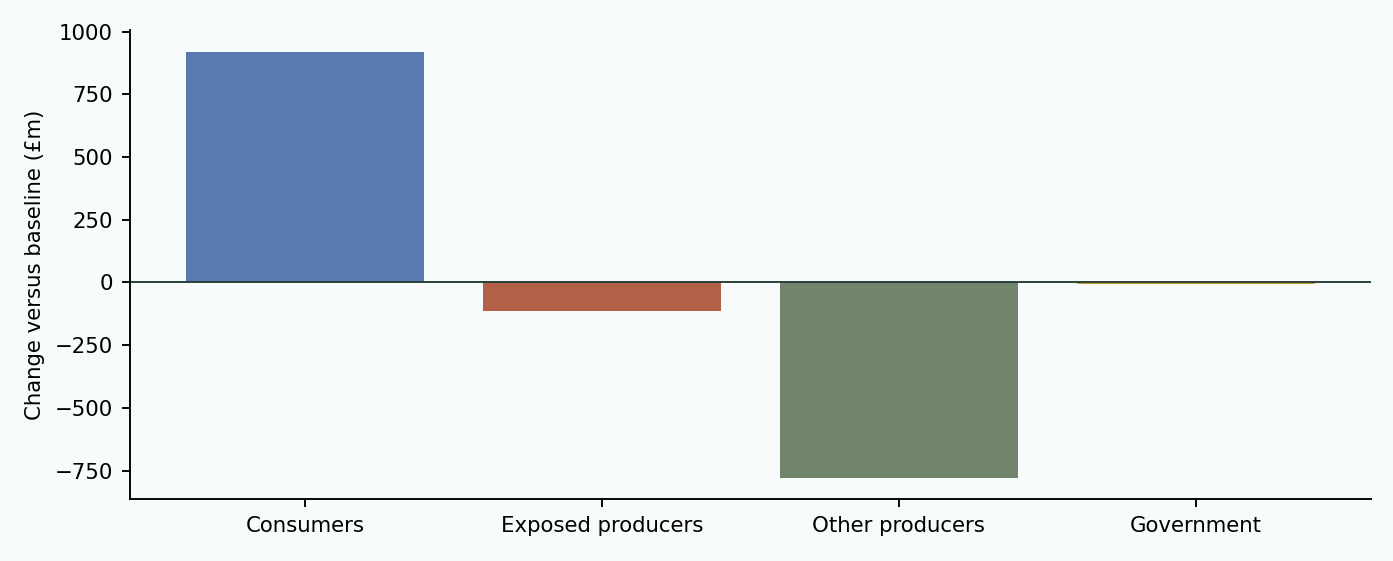
An export-demand shock can lower domestic prices by redirecting product. Consumers may gain while producers lose. Restoring exports can therefore reduce the short-run domestic consumer gain even while improving producer outcomes. This is why gross exports at risk and domestic welfare are not interchangeable.
| Scenario | Consumers/users | Exposed producers | Other producers | Government | Domestic welfare |
|---|---|---|---|---|---|
| Published baseline | £0 | £0 | £0 | £0 | £0 |
| FMD market disruption | £1.48bn | -£237.92m | -£1.02bn | £0 | £225.29m |
| FMD + economic mitigation | £919.90m | -£114.36m | -£779.80m | -£5.00m | £20.74m |
7. Trade and double-counting rules
Gross blocked export revenue is a liquidity exposure, not a welfare loss. Redirected exports already affect domestic prices and quantities inside the PE model. Adding gross blocked revenue to PE surplus changes would double count the trade channel. Gross output, farm contribution, compensation, public resources and welfare are therefore reported separately.
8. Sensitivity analysis
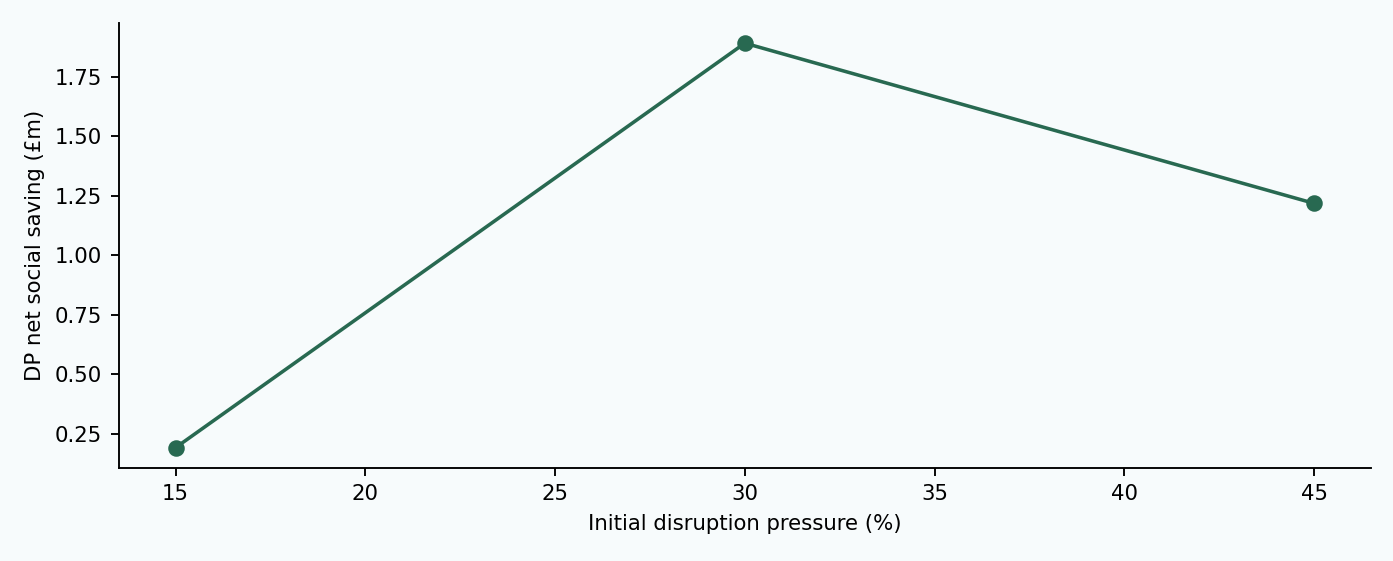
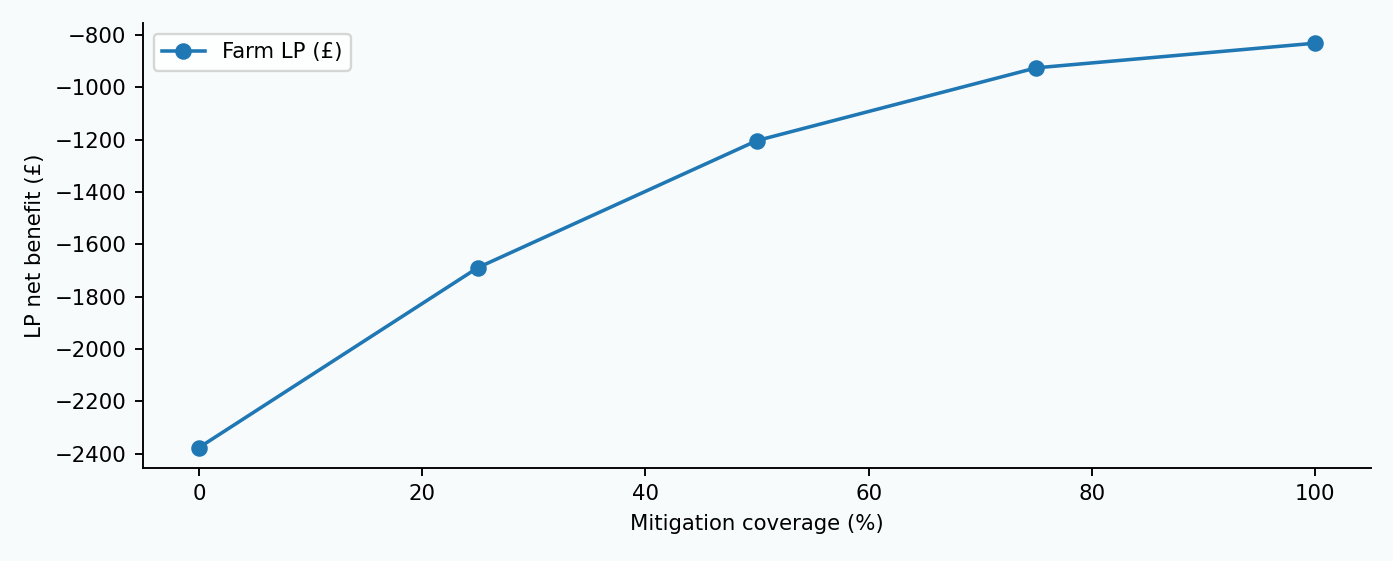
Coverage sweeps re-solve the LP and PE at each selected mitigation share. DP comparisons change initial disruption pressure while holding other assumptions fixed. These are deterministic structural tests, not confidence intervals.
| Mitigation coverage | LP net benefit | PE net domestic welfare change |
|---|---|---|
| 0.0% | -£2,377 | -£177.03m |
| 25.0% | -£1,689 | -£187.34m |
| 50.0% | -£1,203 | -£199.29m |
| 75.0% | -£925 | -£212.91m |
| 100.0% | -£831 | -£228.20m |
| Initial pressure | Net social saving | Government expenditure | Optimised social cost |
|---|---|---|---|
| 15.0% | £192,329 | £459,701 | £5.06m |
| 30.0% | £1.89m | £699,163 | £5.40m |
| 45.0% | £1.22m | £519,758 | £6.36m |
9. Limitations and source audit
Farm defaults are prototypes, PE elasticities are editable scenarios, and DP transitions are not empirically calibrated. Product quality, bilateral reopening, processing capacity, storage, Northern Ireland arrangements and foreign welfare are outside the present PE. Barnes et al. informs the farm-cost taxonomy only; its bTB unit costs are not transferred to FMD.
| Displayed model | Repository source | Integrated function | Important boundary |
|---|---|---|---|
| Farm LP | legacy_pages/506_Syntera_Farm_LP_TAD.py | Monthly simplex LP: enterprise head and feed allocation | Sheep and cattle only; prototype farm defaults |
| Policy DP | Page 521 / BTV audited DP architecture; app/fmd_uk_economic_twin.py reviewed | Bellman solution over aggregate economic states | New FMD economic transition assumptions; no disease-spread simulation |
| Market PE | model/uk_fmd_pe_engine.py lineage plus Syntera PE engine | Price clearing and welfare integration | Editable aggregate baseline; repository trade CSV candidates are empty |
| Published scenario | Feng, Patton and Davis (2017), Tables 2-4 | Scenario selector and price/output-loss anchors | Historical model results; not a 2026 forecast |
10. Reproducibility and research agenda
Changing an input invalidates the previous output until the model is rerun. Downloads retain engine version, timestamp, scenario classification, complete inputs and nested results. The next empirical version requires verified product-level trade flows, current farm budgets, fiscal line items, calibrated elasticities and matched economic recovery transitions.
Model results JSON · Inputs JSON · Tables CSV · Archived engine · Full PDF
References
- Feng, Patton and Davis (2017), Frontiers in Veterinary Science 4:129.
- Barnes et al. (2023), Preventive Veterinary Medicine 211:105808.
- Defra, Agriculture in the United Kingdom 2025, Chapter 8.
- National Audit Office (2002; 2025).
Contact
For questions about the analysis, tailored appraisal or research collaboration, contact Dr Bouda Vosough Ahmadi.